About Me

I am a proud Michigan State University data science student graduating in May 2026. Throughout my academic career, I have built and evaluated machine learning models, worked extensively with data cleaning and analysis pipelines, and collaborated with other data scientists on applied projects.

I have worked with the full data science workflow, from writing SQL queries against relational databases to training and deploying models on cloud platforms. I have hands-on experience with Python, SQL, AWS (S3, Athena, SageMaker), Docker, pandas, scikit-learn, matplotlib, and seaborn.

My projects focus on turning complex data into clear, actionable insights. It is my priorty to be able to justify, validate, and reproduce my work.

Projects

Thumbnail for NYC 311 Ticket Resolution Time Prediction

NYC 311 Ticket Resolution Time Prediction

Built an end-to-end machine learning pipeline on AWS to predict how long NYC 311 complaints take to resolve. Used Amazon S3 for data storage, AWS Athena for querying, and Amazon SageMaker to train and deploy a linear regression model on 170k+ service requests across 15 city agencies.

Python AWS S3 AWS Athena Amazon SageMaker (Linear Learner) pandas numpy Jupyter Notebooks
More details

Problem

As part of a cloud computing course project, I worked with a simulated agency operations scenario: given a 311 complaint, can we predict how long it will take to resolve? The dataset was a 170k-record instructor-provided sample of real NYC Open Data complaints, used to practice building end-to-end ML pipelines in a cloud environment.

Approach

Pulled data from S3 using Athena SQL queries and engineered features including agency, borough, complaint type, zip code, day of week, hour of day, and same-day complaint volume. Trained a SageMaker Linear Learner estimator (regressor) on an 80/20 train/test split, then evaluated against a naive baseline. The focus was on learning the full AWS ML workflow, from raw data in S3 through model training and evaluation on SageMaker.

Results & Impact

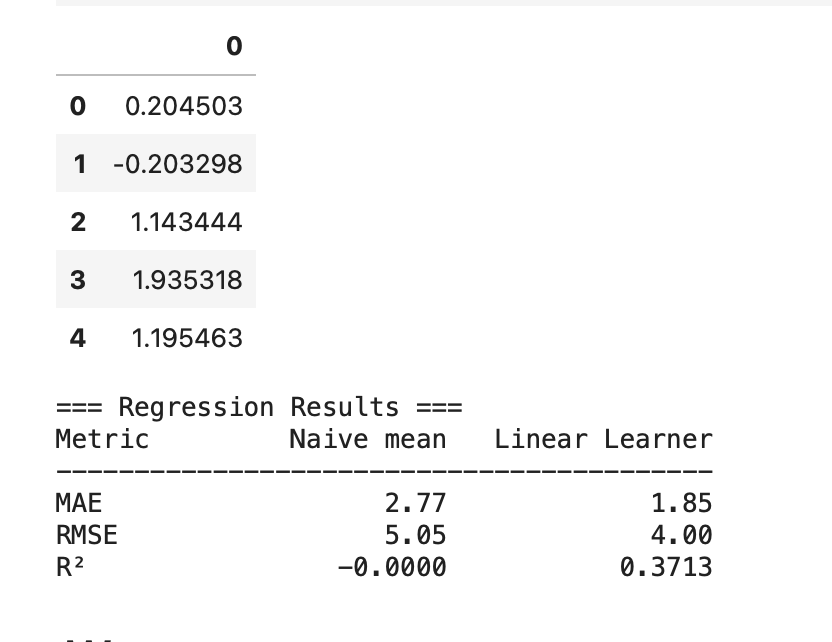
The SageMaker Linear Learner model achieved an MAE of 1.85 days and RMSE of 4.00 days, with an R^2 of 0.37, an improvement over the naive mean baseline (MAE 2.77, RMSE 5.05). The project demonstrates a full cloud ML workflow from raw S3 data through SageMaker training.

Thumbnail for Regional Sales Analysis with Python and Docker

Regional Sales Analysis with Python and Docker

Built a reproducible sales analysis pipeline that cleans and merges January transaction and customer data, produces a regional summary table, and generates revenue bar charts by region and customer segment. The project is fully containerized with Docker for easy reproducibility.

Python pandas matplotlib seaborn Docker uv
More details

Problem

As part of a data engineering and reproducibility course project, the goal of the existing project was to analyze January sales data across regions and customer segments. My personal goal was to build the pipeline in a way that anyone could reproduce the results with a single command.

Approach

Understood/edited a Python pipeline with separate source files handling data loading and cleaning, and plot generation. The script merges sales transactions with a customer lookup table, builds a summary grouped by region, and outputs both a CSV report and two revenue bar charts. Packaged the entire workflow in a Dockerfile so results can be reproduced with either a virtual environment or a containerized run.

Results & Impact

Produced a 12-row regional summary CSV and two revenue charts — one by region and one by customer segment (added as a personalization of the original analysis using seaborn).The project demonstrates skills in Python, data cleaning and merging, visualization, and containerized reproducibility.

Thumbnail for Actor Revenue Analysis with SQL and the Sakila Database

Actor Revenue Analysis with SQL and the Sakila Database

Analyzed a DVD rental database to identify which film actors drive the most revenue and rentals. Used advanced SQL techniques including multi-table JOINs, CTEs, and window functions to produce a manager-style report ranking actors by business performance.

SQL (MySQL) Python Adminer pandas Docker Jupyter Notebooks
More details

Problem

Using the Sakila sample DVD rental database as part of a SQL analysis course project, the goal was to answer a practical business question: which actors generate the most revenue and rentals for the store? The intended audience was a simulated store manager or content acquisition team looking to make data-informed decisions about their film catalog.

Approach

Connected to a Dockerized MySQL instance of the Sakila database from a Jupyter notebook using Adminer. Wrote and validated a series of complex queries which involved multi-table JOINs linking actors to payments, GROUP BY and HAVING aggregations to filter high performers, a CTE to compare each actor's revenue against the store average, and a RANK() window function to produce a final ranked report table.

Results & Impact

Produced a clean manager-style report ranking actors by total revenue and rental count, with each actor's performance benchmarked against the store-wide average. The project demonstrates end-to-end SQL analysis skills from raw relational data through a polished, reproducible reporting workflow.

Contact